Measuring Road Freight Disruption in Europe: From Gut Feeling to Index
European road freight is absorbing more disruption than at any point in recent memory — a structural driver shortage of 444,000 unfilled positions, double-digit toll increases, falling truck registrations, volatile fuel, and geopolitical shocks that redraw trade flows within weeks. Yet most transport teams still manage disruption by anecdote: a planner's memory of which border was slow last winter. This post explains the main disruption categories, why averages hide them, and how to build a simple, data-driven disruption view for your own network — the same logic behind a market-wide disruption index.
Why "it's been a chaotic year" is not a metric
Every operations meeting in European logistics contains some version of the sentence "the market is crazy right now." It is usually true and never actionable. Which lanes got slower? By how much? Is the Friday afternoon dwell at that Milan hub a blip or the new normal? Is the problem capacity, congestion, or compliance checks?
Disruption only becomes manageable when it is measured — the same way punctuality only improved once it stopped being a feeling and became a number per lane. Shippers have begun asking for this in tenders: not just "what is your on-time rate" but "how resilient is your network, and how do you know?"
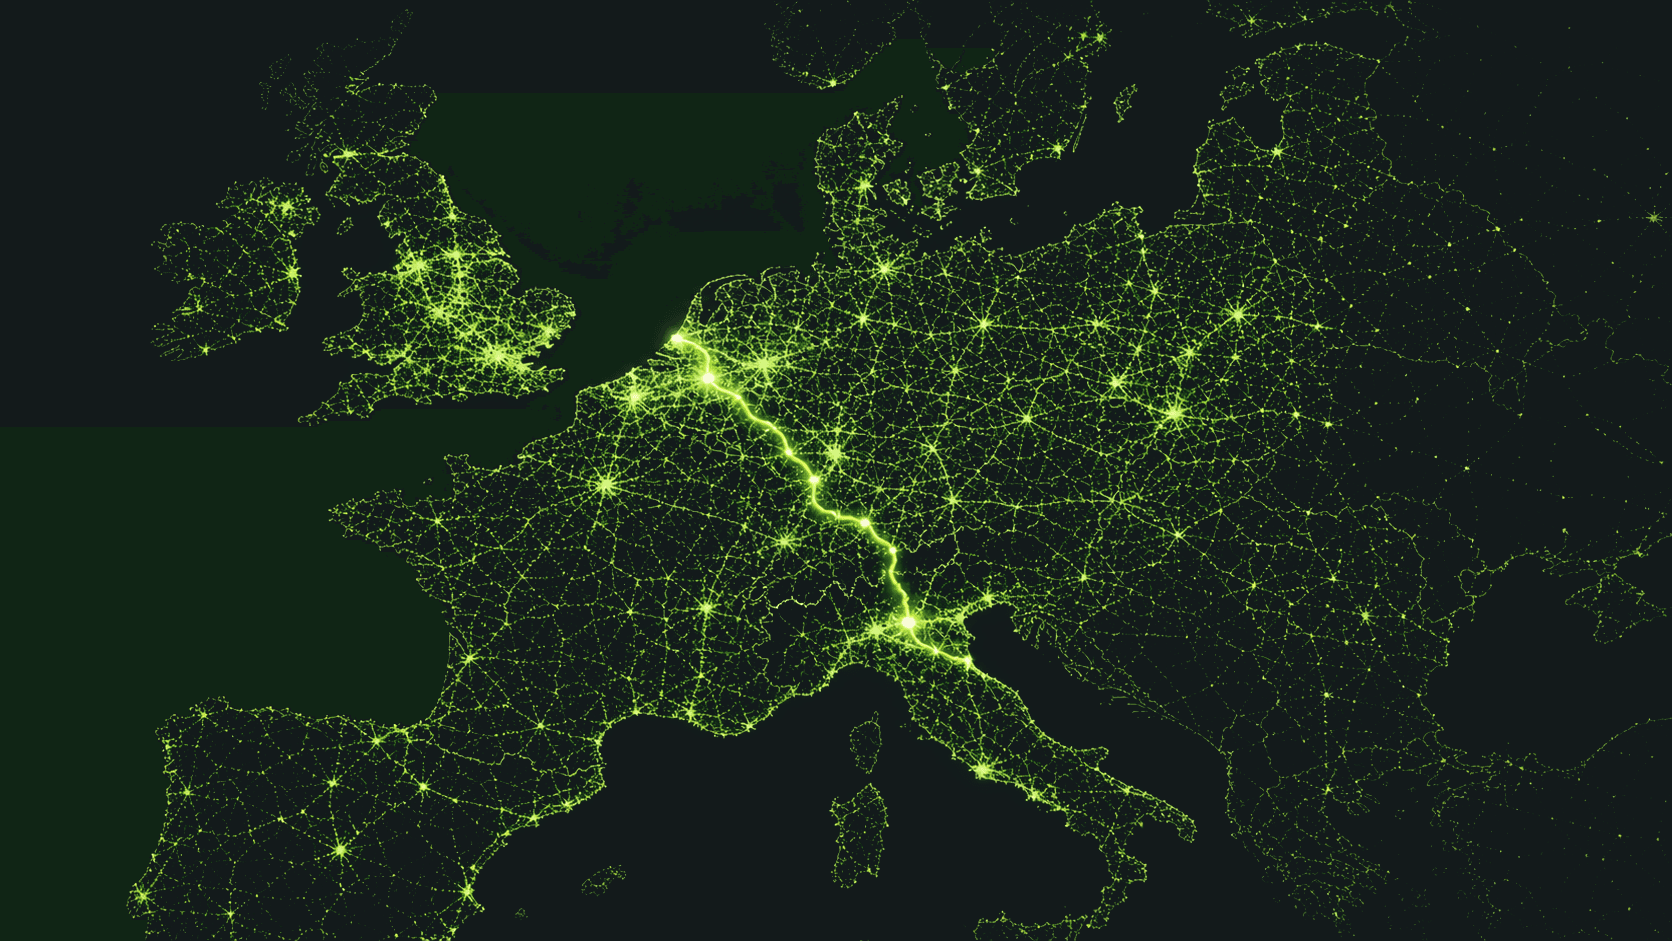
The raw material exists. Every truck movement leaves a data trail — transit times, dwell times, route deviations, waiting at borders and ramps. Aggregated, those trails describe the actual disruption level of a corridor far more honestly than headlines do.
The disruption landscape, 2026 edition
Structural capacity shortage. Europe was short roughly 444,000 truck drivers in 2025, with one-third of the existing workforce over 55 and under-25s below 6%. The shortfall is projected to worsen sharply without intervention. Meanwhile new truck registrations fell 6% in 2025. This is not a cycle that mean-reverts; it is the new operating floor. One visible market signal: contract rates overtook spot rates in late 2025 as shippers locked in capacity early — a flight to reliability.
Cost shocks. Tolls jumped 14.4% in Czechia and 7.7% in Austria, with Poland phasing in steep rises; diesel remains volatile; and CO2-differentiated tolling re-prices corridors depending on fleet composition. Cost disruption is quieter than a blocked border, but it reroutes traffic just the same.
Geopolitical and trade shifts. Tariff changes and conflict-driven trade disruption are reshaping export corridors with little warning, and short-term forecasting has become markedly less reliable across the sector. Networks built on stable flow assumptions are being re-planned quarterly.
Operational and seasonal friction. Strikes, weather, infrastructure works (bridge closures, the perennially constrained Alpine crossings), and border waiting times deliver the week-to-week noise that planners feel most directly.
The categories interact: a strike on one corridor pushes volume onto another that has no spare capacity — because of the structural shortage — turning a local event into a regional one.
Where transport teams get stuck
Anecdote-driven planning
Lane knowledge lives in individual planners' heads. It is often good — and it leaves with them, doesn't scale, and silently goes stale when conditions change.
The averages trap
Monthly average transit time on a lane can look stable while variance explodes. A lane that takes 18 hours ±1 and one that takes 18 hours ±7 are entirely different risks — same average. For disruption, the spread is the signal. If you track one number per lane, track the variance (or a percentile), not the mean.
No baseline
When a customer asks "is this delay exceptional?", many carriers cannot answer, because they never established what normal looks like per lane and weekday. Without a baseline there are no anomalies — just vibes.
Data trapped in silos
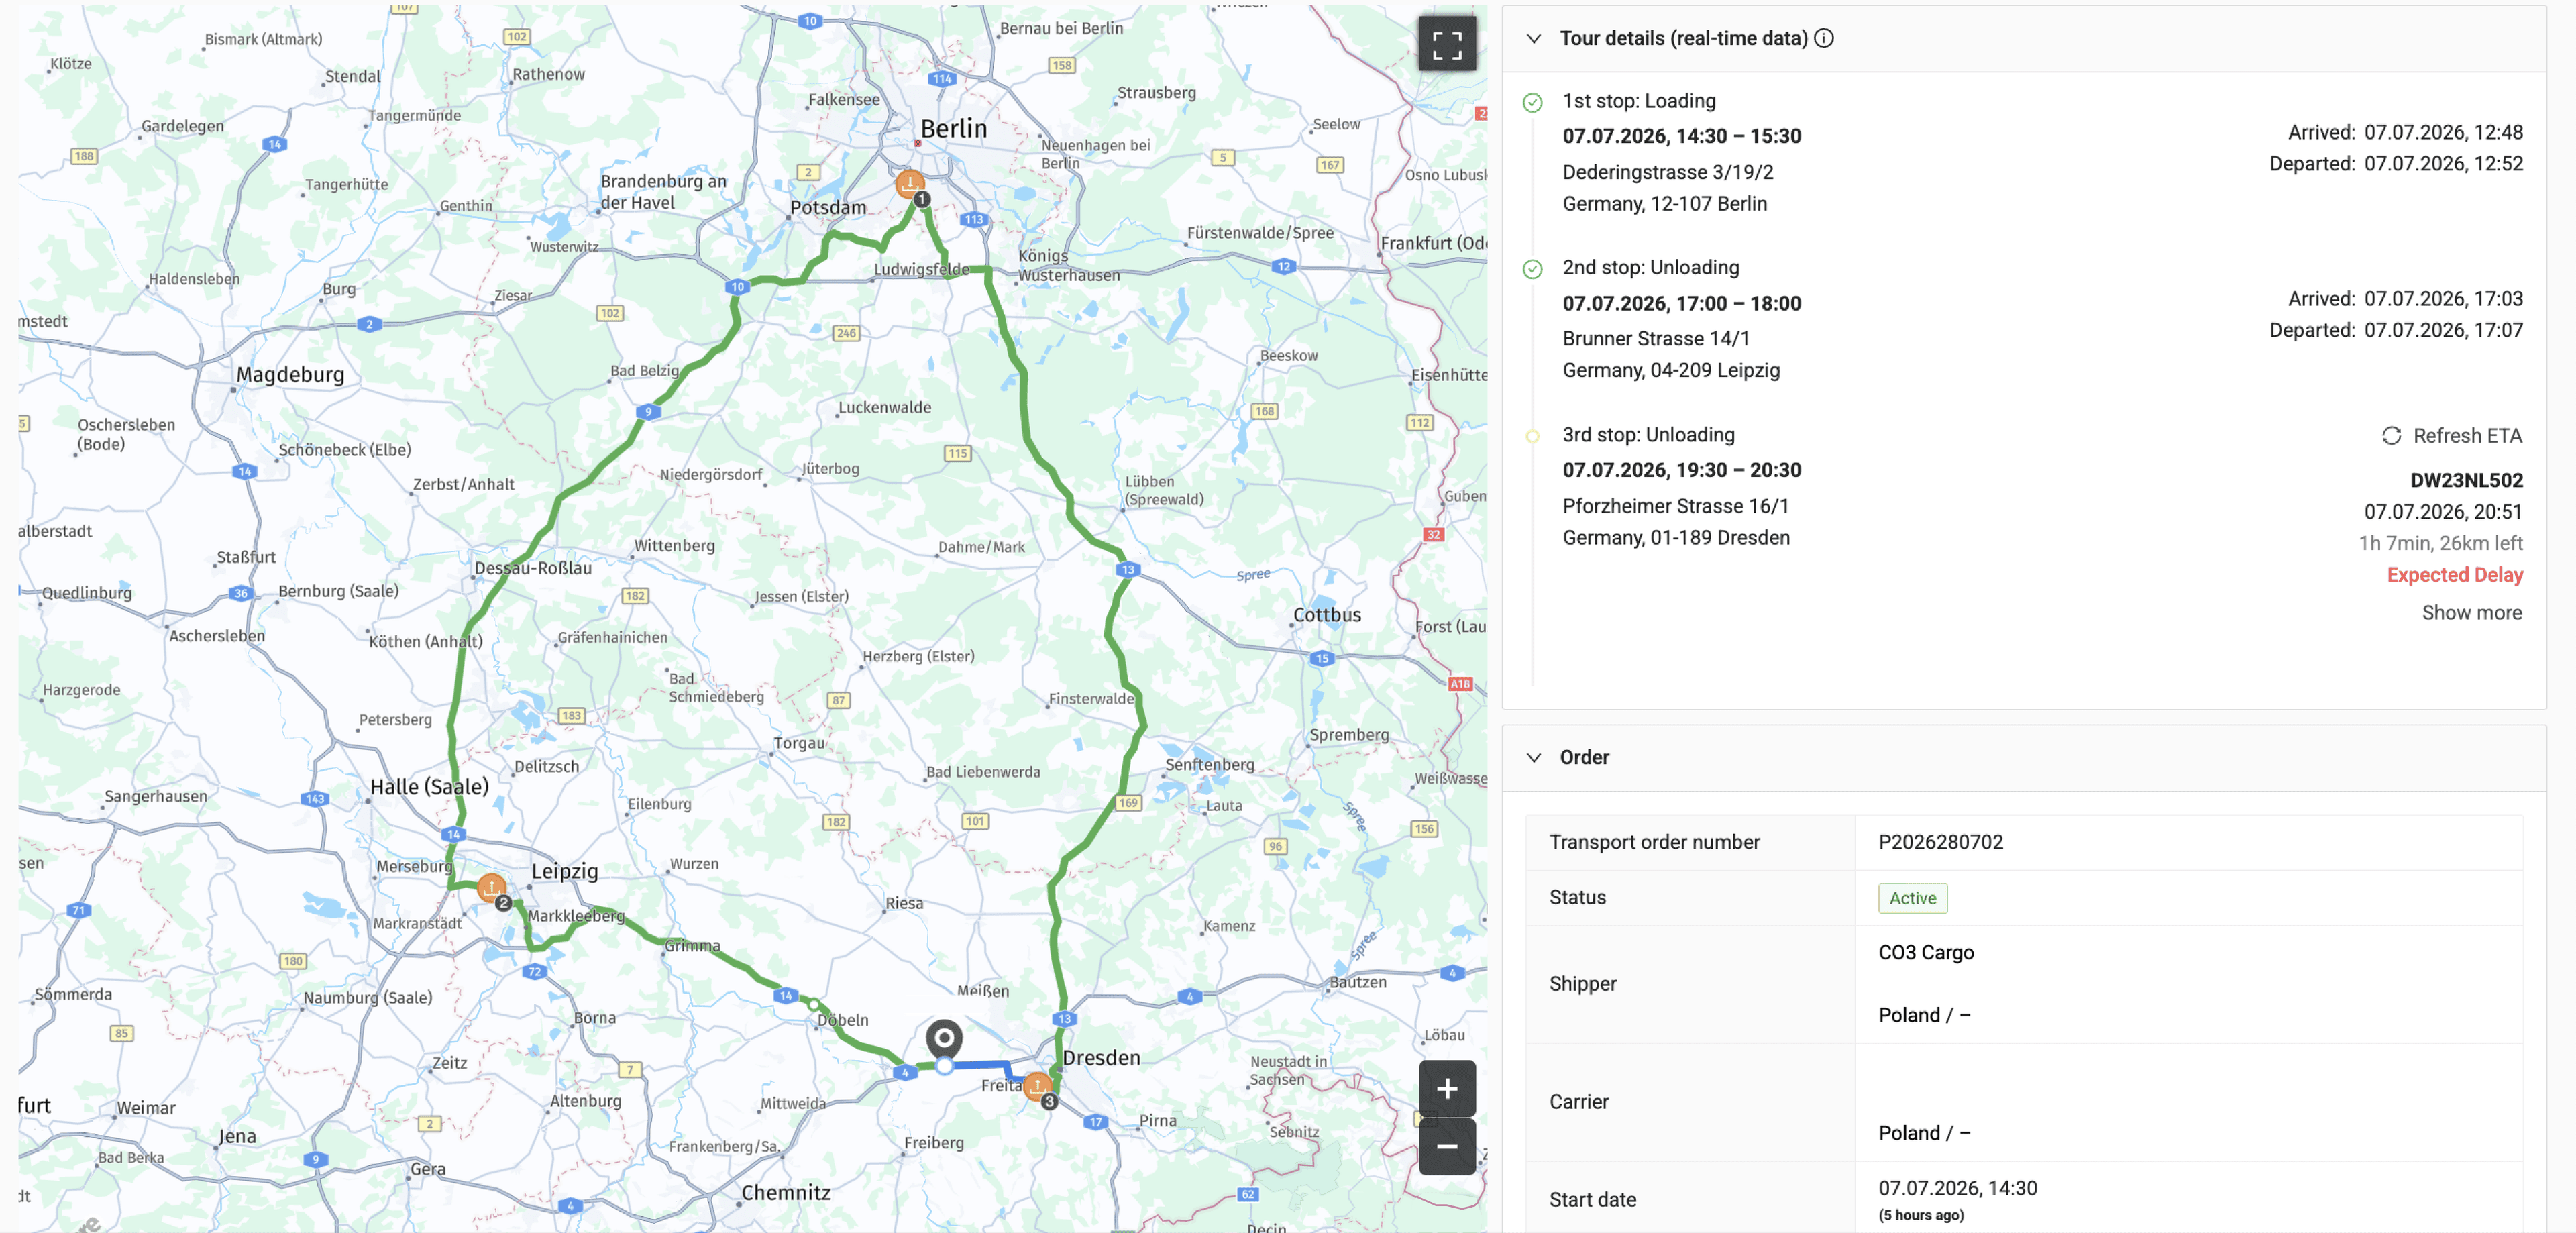
Transit evidence sits in telematics systems (own fleet and subcontractors'), TMS records, and driver apps — fragmented across formats. The disruption picture only emerges when movements are pooled into one comparable dataset.
Building your own disruption view
The method behind any disruption index — internal or market-wide — is the same four steps:
- Pool the movement data. Every trip, own fleet and subcontractors, normalised into one schema: lane, timestamps, dwell events, route actually taken.
- Establish baselines. Median transit time and dwell per lane, per weekday, from a rolling window of weeks.
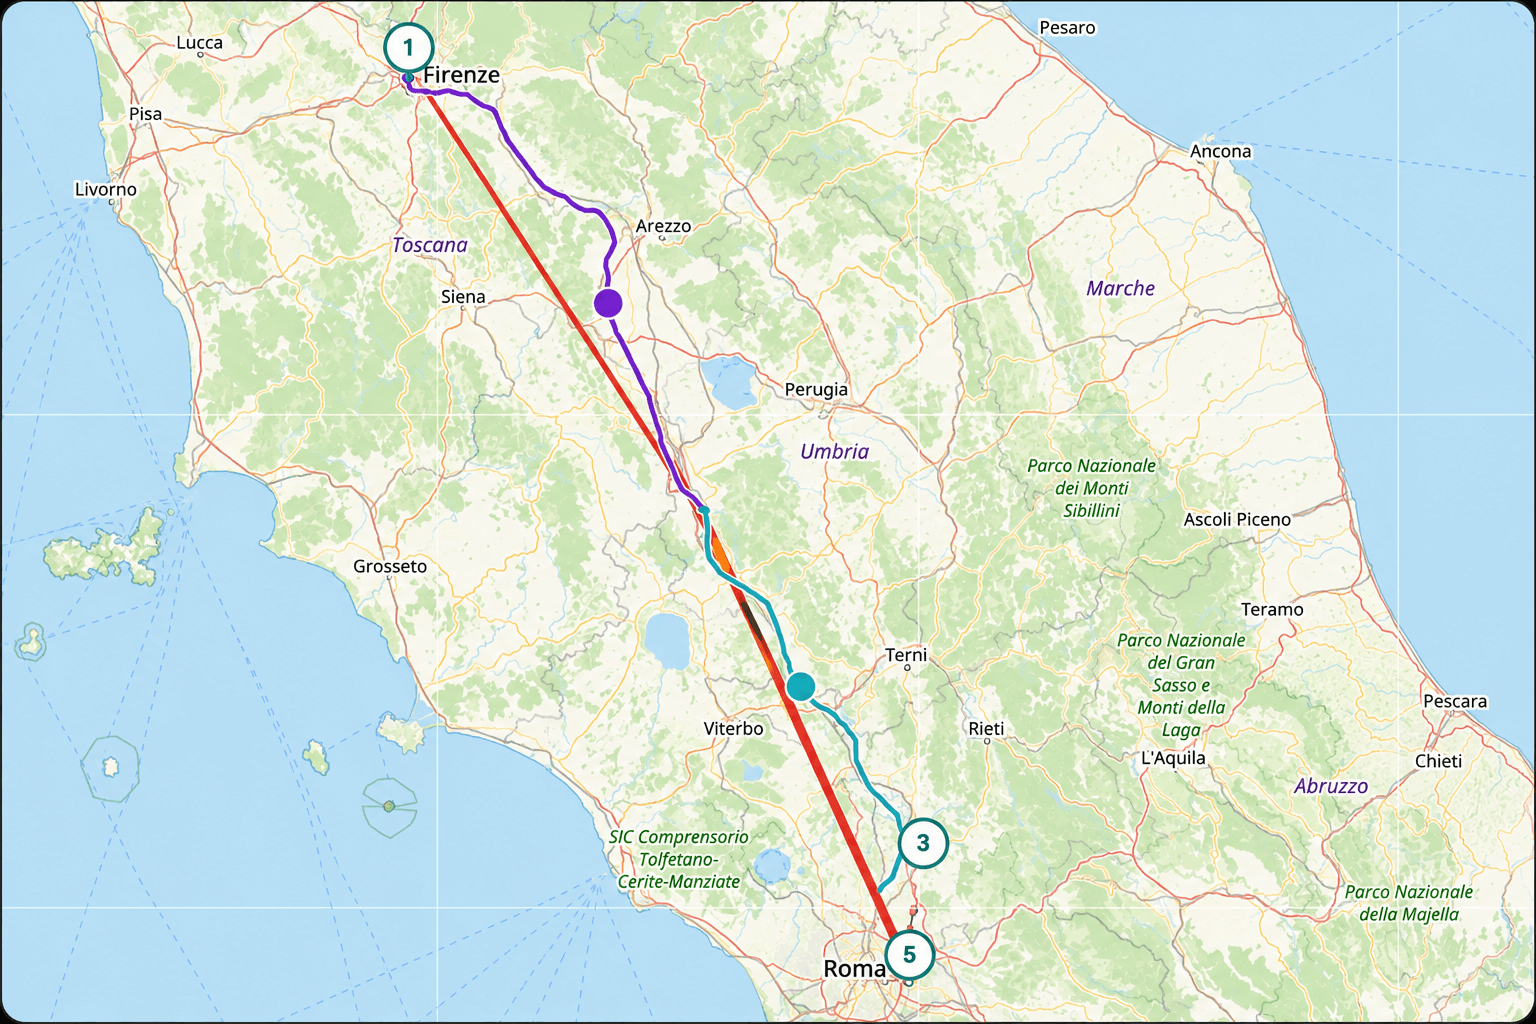
- Measure deviation, continuously. Score each new trip against its baseline. Aggregate to lane and corridor level: share of trips beyond tolerance, growth in variance, dwell creep at specific sites and crossings.
- Publish internally and review weekly. A simple red/amber/green per corridor, with trend arrows, changes routing and buffer decisions immediately. The sophistication is in the data plumbing, not the statistics.
How CO3 does this today?
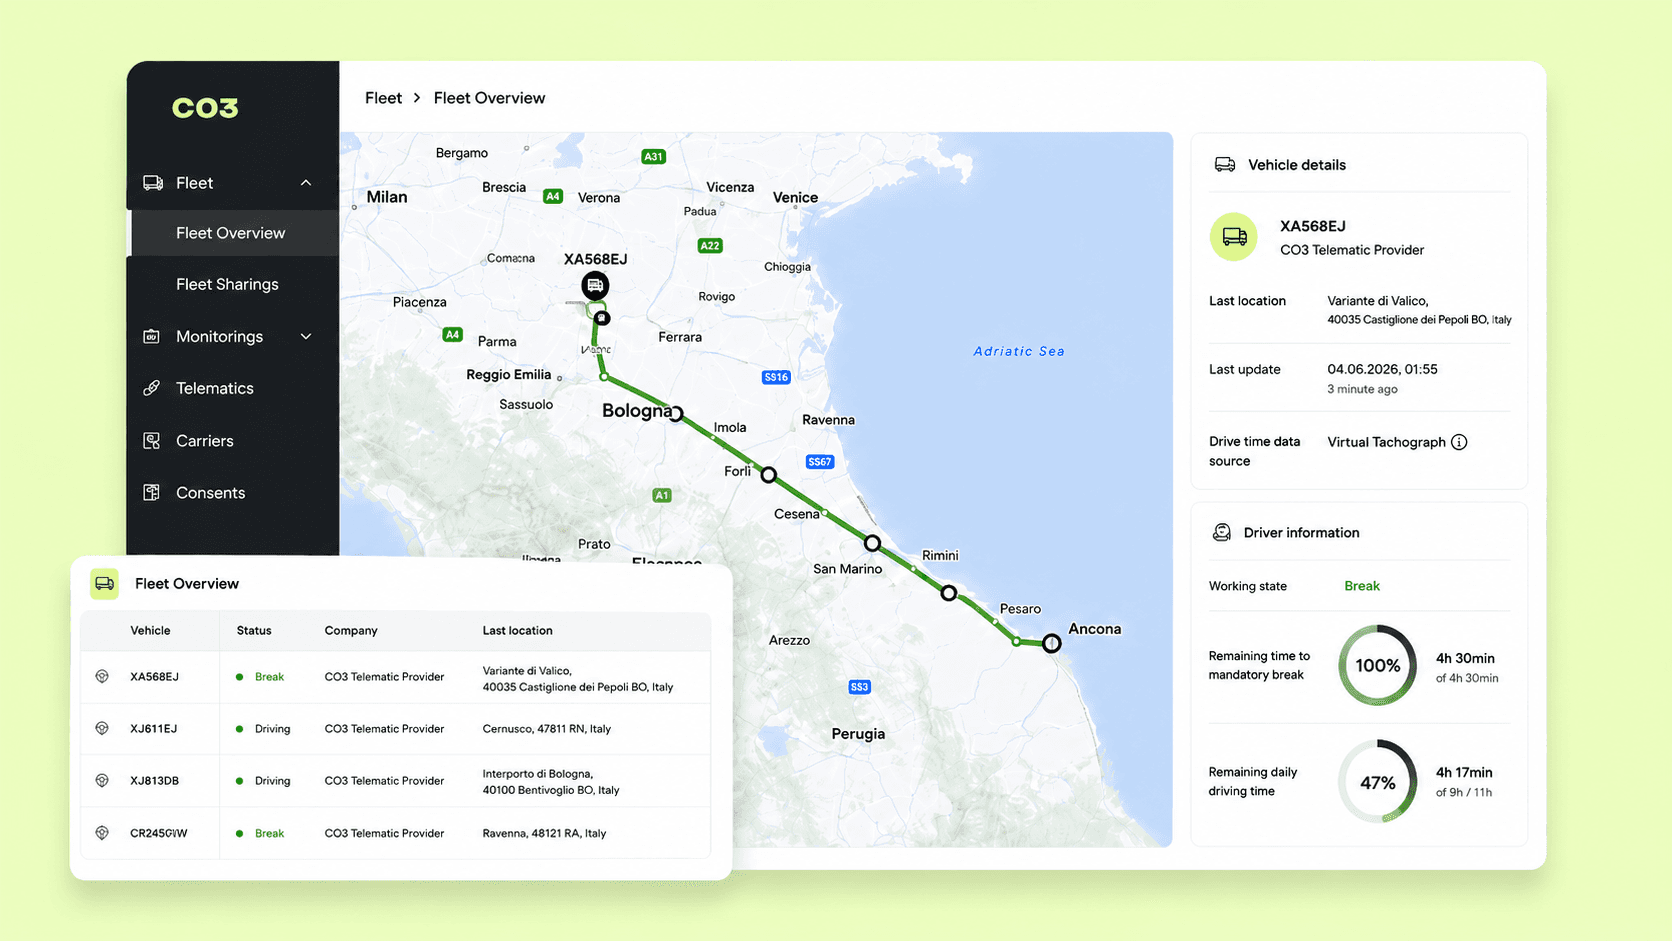
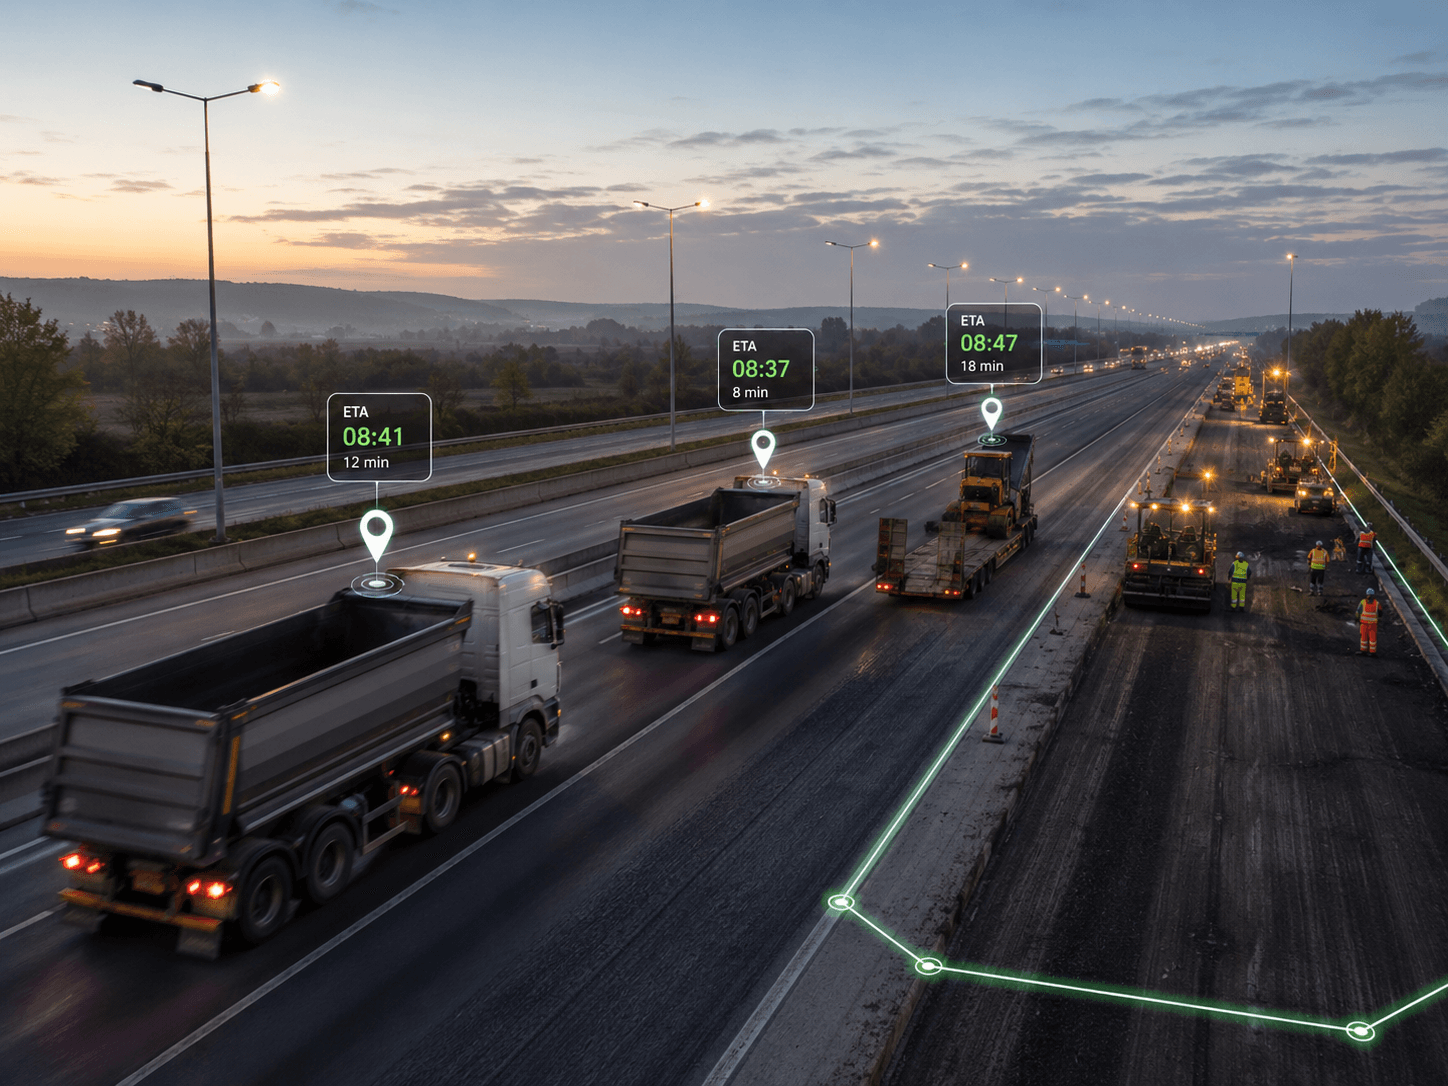
The prerequisite for any disruption measurement is complete, normalised movement data — and that is CO3's core: 500+ telematics integrations across trucks, trailers, and subcontractor systems, unified into a single API without new hardware. Trip and position histories establish lane baselines; live positions and ETA predictions flag deviations as they develop rather than after delivery. Because subcontractor vehicles are in the same feed, the disruption picture covers the whole network, not just owned assets.
Getting started without a data science team
- Pick your five most important corridors. Pull 8–12 weeks of trip history and compute median and 90th-percentile transit time per lane and weekday. That is your baseline — one afternoon of work with clean data.
- Set tolerance thresholds. For example: amber when a week's 90th percentile exceeds baseline by 15%, red at 30%. Crude thresholds beat no thresholds.
- Make it a weekly ritual. One page, five corridors, traffic lights and trends. Decisions — buffers, departure times, customer expectation-setting — follow naturally once the page exists.
Self-assessment: how disruption-ready are you?
- Do you have a quantified baseline (median + spread) for transit time on your key lanes?
- Can you distinguish a one-off delay from a deteriorating trend per corridor?
- Are subcontractor movements part of your disruption picture?
- Do you track dwell time at your top sites and border crossings?
- Would you detect a 20% variance increase on a key lane within two weeks?
- Do routing and buffer decisions reference data rather than planner memory alone?
- Can you show a customer evidence of what "normal" looks like on their lane?
- Is any of this reviewed on a fixed weekly cadence?
Three or more "no" answers means disruption is managing you. CO3 can help you stand up the movement-data layer the measurement needs.
What to watch over the next 12–18 months
- Driver shortage worsens before it improves. Industry projections point to a steep deterioration through 2026 as retirements outpace recruitment; capacity buffers keep shrinking.
- Tolls and compliance add friction. Further toll rises and CO2-differentiation, plus enforcement under the Mobility Package, keep adding structural cost-and-time variability by corridor.
- Resilience enters the tender. Expect shippers to ask carriers for variance data, not just punctuality averages — networks with measured resilience win the risk-sensitive freight.
- Indices become market infrastructure. As pooled movement data grows, expect public corridor-level disruption indices for European road freight — useful, and a benchmark you will be compared against.
Closing thought
Disruption in European road freight is not going back to normal; the shortage is structural, the costs keep moving, and geopolitics is now an operating variable. The competitive difference is no longer who experiences disruption — everyone does — but who measures it, sees it forming, and re-plans first. The data trail your fleet already produces is the instrument. CO3 makes it readable.
Glossary
- Disruption index: A composite measure tracking deviation from normal transport conditions (transit times, dwell, capacity) across lanes or markets.
- Baseline: The statistically "normal" value for a lane metric (e.g., median transit time per weekday) against which deviations are measured.
- Variance / spread: How widely values scatter around the average; in disruption terms, the unpredictability of a lane.
- Percentile (e.g., P90): The value below which 90% of observations fall; P90 transit time captures the bad-day scenario averages hide.
- Dwell time: Time a vehicle spends stationary at a site, border, or hub.
- Spot vs contract rates: Spot = one-off market price; contract = agreed longer-term price. Contract exceeding spot signals a flight to secured capacity.
- Cabotage: Domestic transport performed by a foreign-registered carrier; regulated under the EU Mobility Package.
- TMS (Transport Management System): Software for planning and executing transport orders.
- ETA (Estimated Time of Arrival): Live-updated predicted arrival time based on vehicle position.




























.png&w=3840&q=75)











.png&w=3840&q=75)