Why AI ETAs Fail Without Normalised Telematics Data

Why AI ETAs Fail Without Normalised Telematics Data
Every visibility vendor now sells "AI-powered ETAs", yet planners still see predictions that jump around, miss obvious delays, or go silent exactly when it matters. The reason is rarely the algorithm. ETA models are only as good as the position data feeding them — and in a real European fleet that data arrives from dozens of telematics systems at different frequencies, formats, and quality levels, with subcontractors often missing entirely. This post explains what an ETA model actually needs to eat, the four input failures that break predictions, and why normalisation across a mixed fleet is the real ETA technology.
The promise and the planner's reality
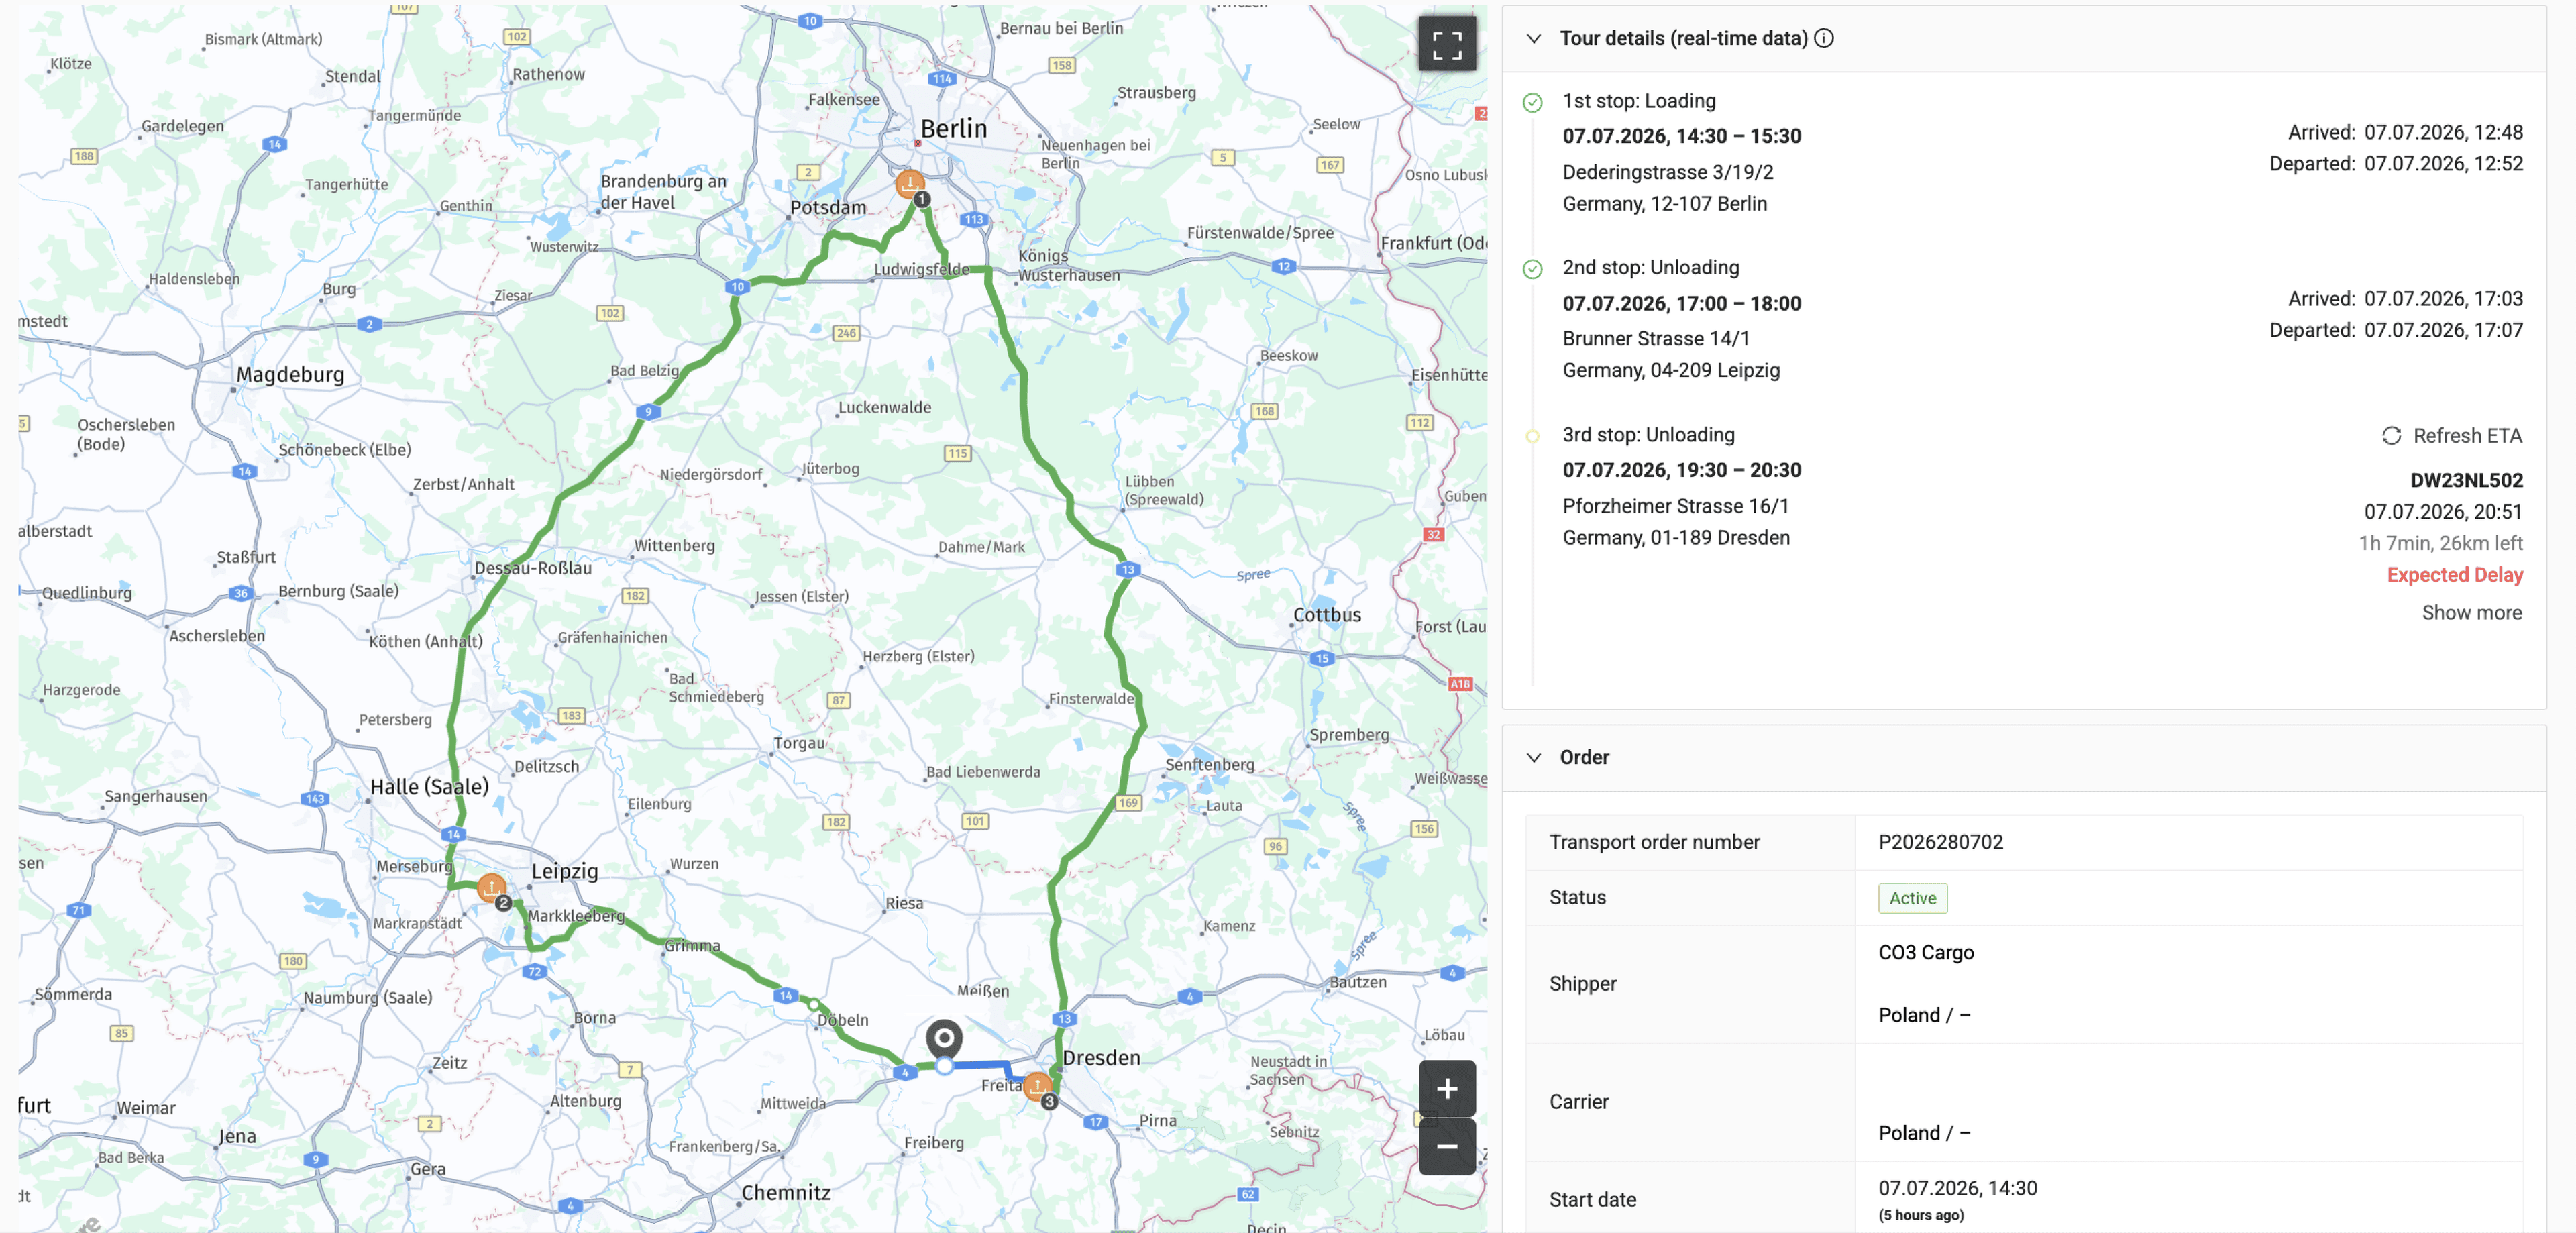
On the demo screen, the AI ETA is a marvel: a confident arrival time, updating smoothly as the truck moves, with traffic and weather factored in. In the planning office, the experience is often different — an ETA that swings two hours on a refresh, a truck "arriving in 40 minutes" that has been parked for its driver's rest break, a subcontracted load with no prediction at all.
The gap between demo and reality is almost never the machine-learning architecture. Research and practitioner write-ups consistently identify input data quality — spotty GPS pings, missing milestones, undetected stops — as the dominant source of ETA error. The model is doing its best with what it gets. What it gets is the problem.
What an ETA model actually eats
Think of an ETA model as a colleague who has watched every trip your fleet ever ran and never forgets. To predict well, that colleague needs four food groups:
Fresh positions, frequently. A position every 30–60 seconds lets the model see acceleration, queuing at a border, the difference between crawling traffic and a parked truck. A position every 15 minutes is a flip-book with most pages missing — the model interpolates, and interpolation is where the wild swings come from.
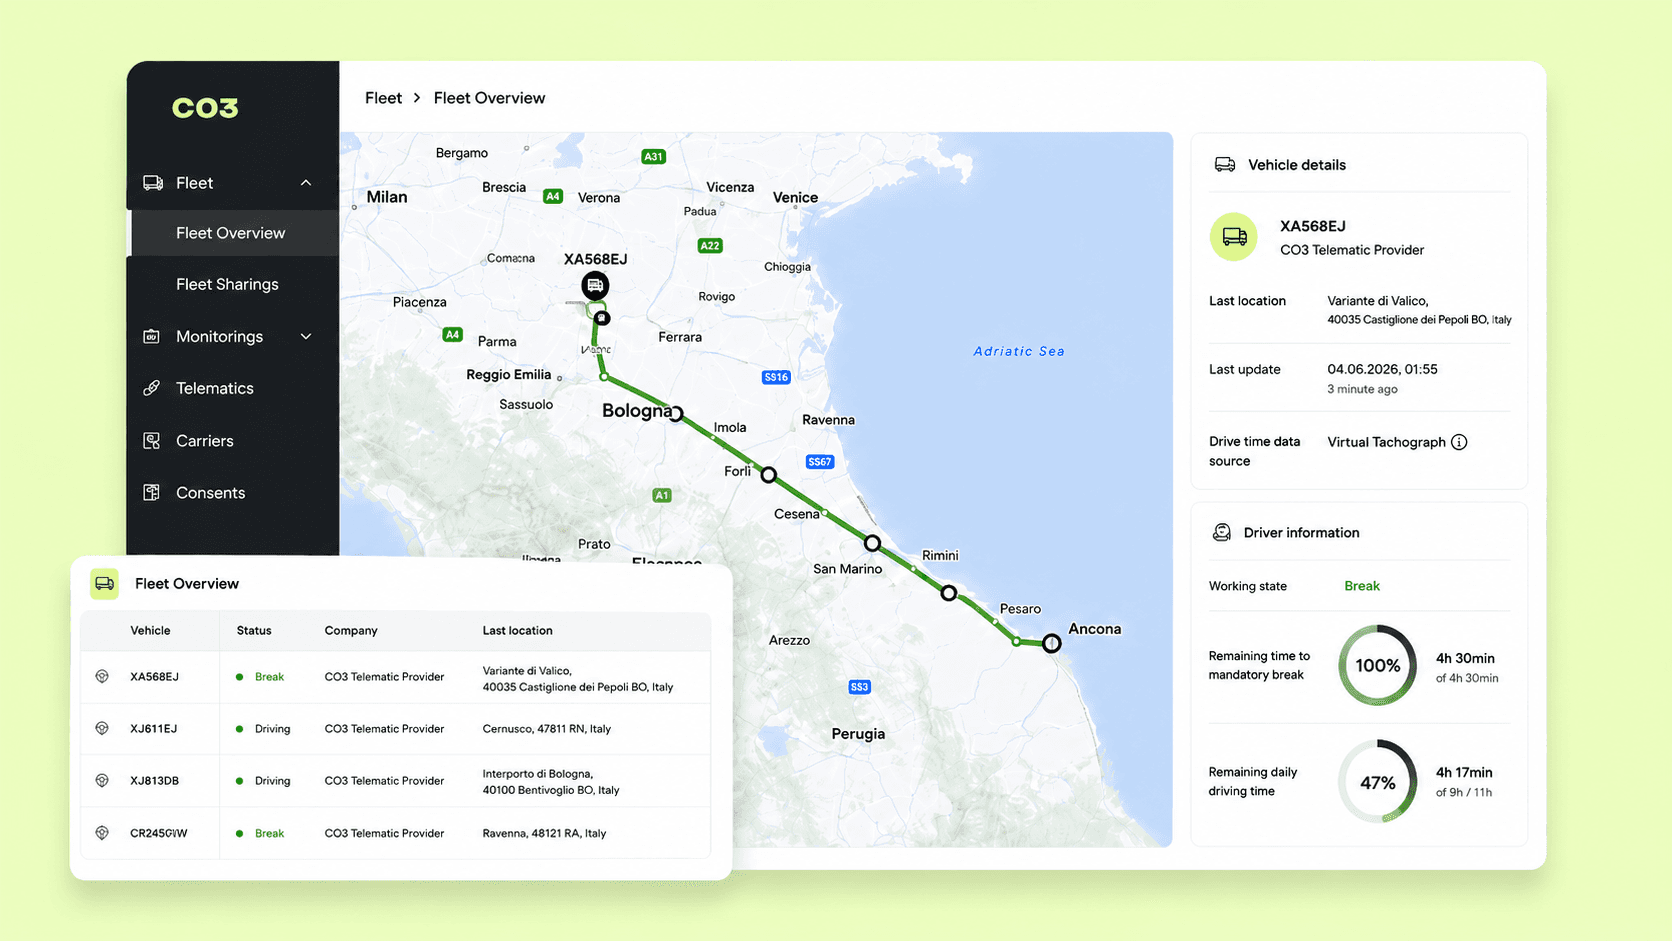
Context beyond the dot on the map. Driving-time status (how long until the driver legally must rest), whether the trailer is coupled, planned route and stops. Two trucks at the same motorway exit have completely different arrival times if one driver has six hours of drive time left and the other has forty minutes. An ETA engine without driving-time context is guessing on exactly the delays that matter most in European road freight.
History — lots of it. Models learn lane variance, weekday patterns, and site behaviour (that this Milan warehouse always adds 90 minutes on Fridays) from completed trips. No history, no learning. A new feed with no past is a student on day one.
Reliable stop and event detection. The model must know, automatically and correctly, when a vehicle has arrived, departed, or is dwelling. If stop detection misfires, the training data itself is mislabelled — and a model trained on mislabelled history confidently learns the wrong lessons.
The four input failures that break AI ETAs
1. The frequency lottery
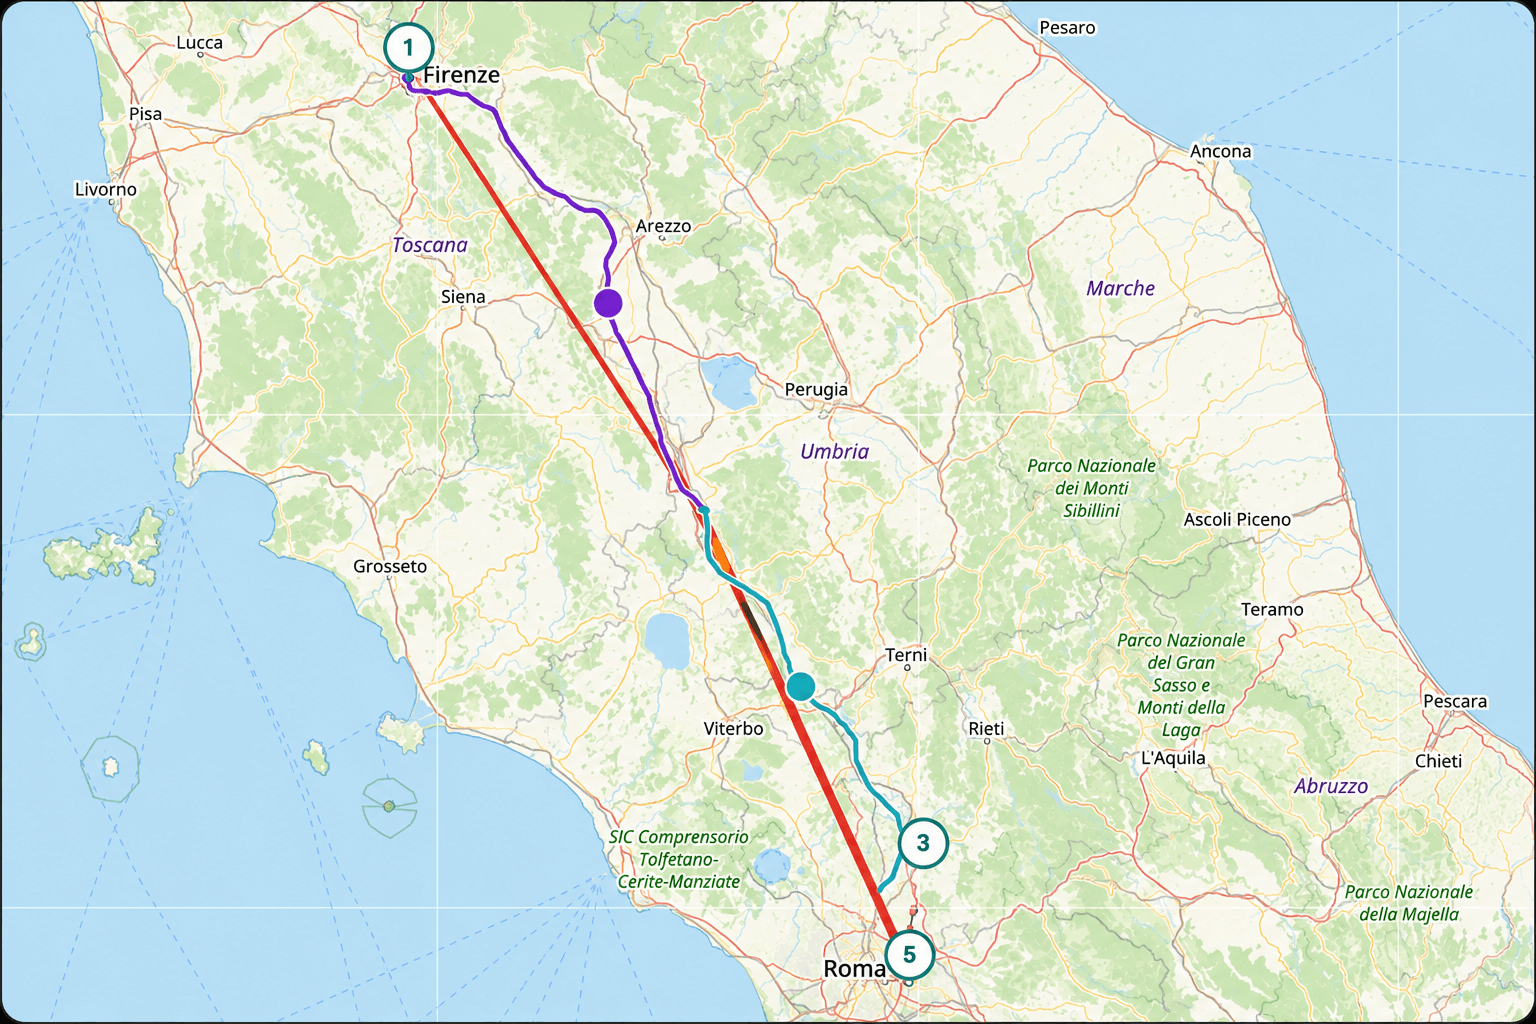
In a mixed fleet, position frequency is not one number. The OEM feed from your newest trucks might update every 20 seconds; an older aftermarket system every 5 minutes; a subcontractor's budget tracker every 15. One model consuming all three behaves brilliantly on the first group and erratically on the last — and your customers experience the average. Knowing the real interval per source is the first diagnostic question of any ETA complaint.
2. The format Babel
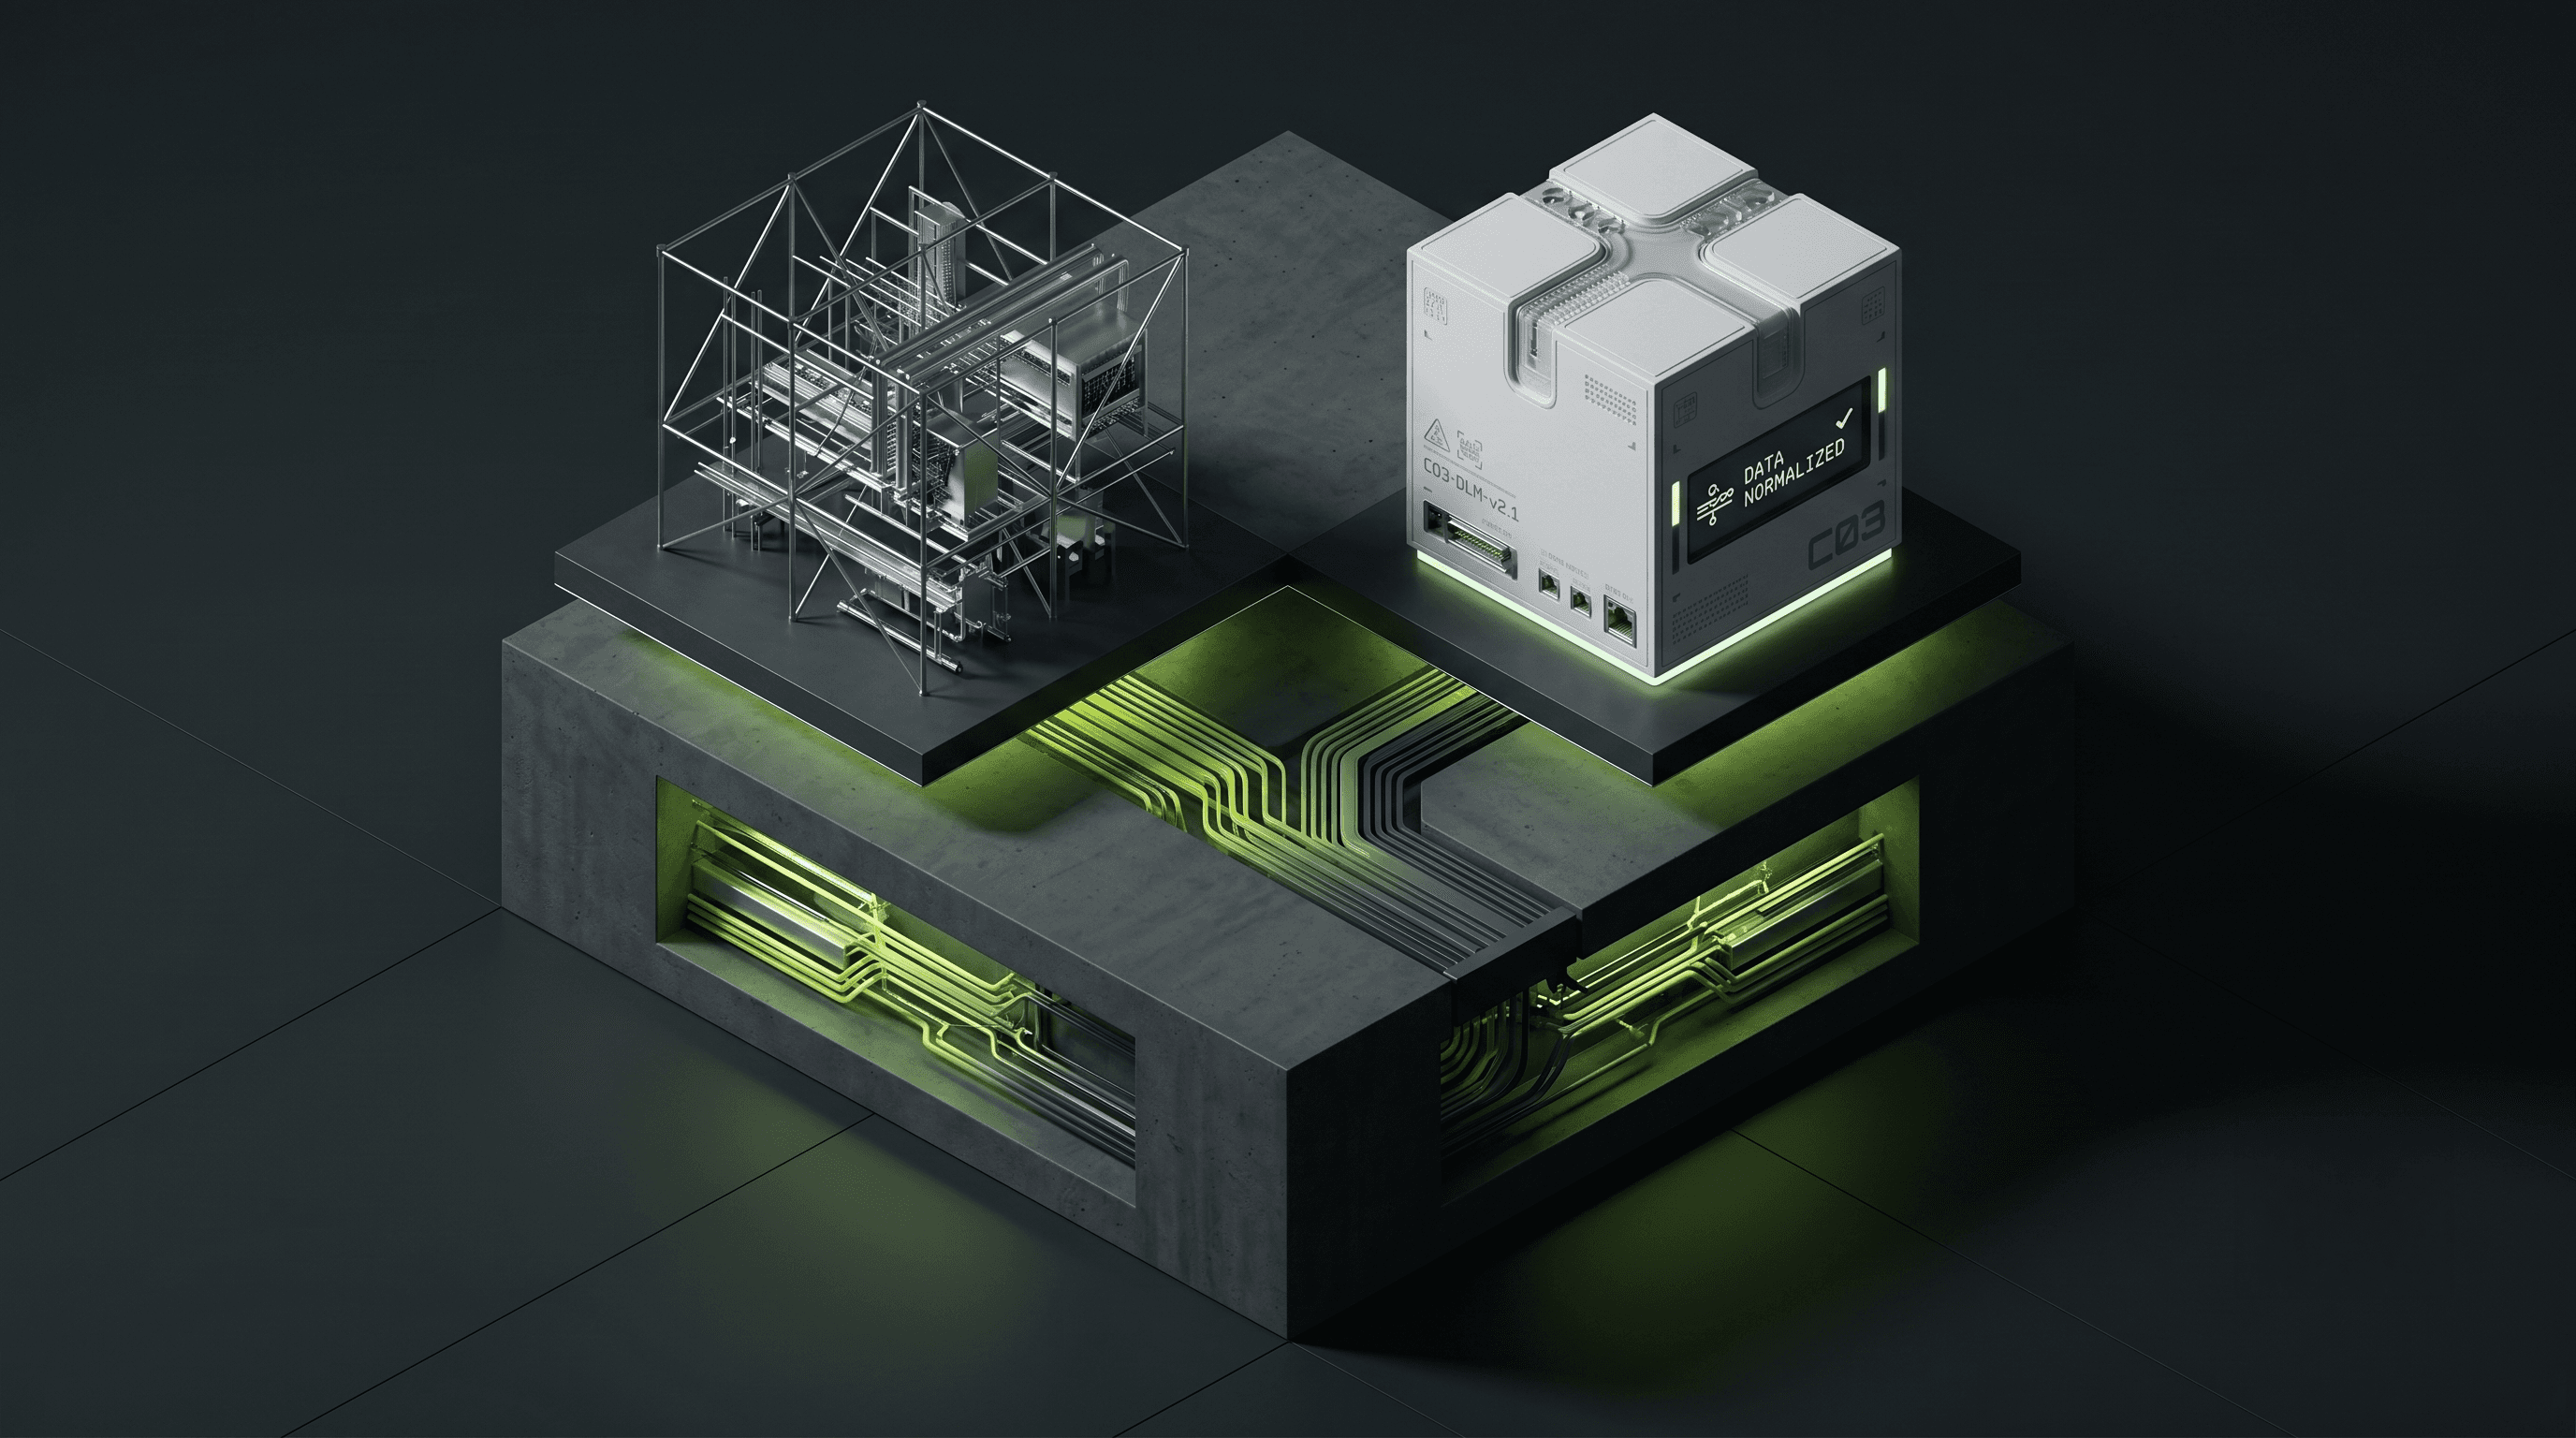
One system reports timestamps in UTC, another in local time. One labels a stop "ignition off", another infers it from speed. Units, field names, and vehicle identifiers differ everywhere. Without rigorous normalisation, these mismatches enter the model as phantom patterns — the model "learns" that one part of the fleet teleports an hour at midnight. Garbage in, confident garbage out.
3. The subcontractor blackout
The hardest input failure is the missing input. Subcontractors run a large share of most European carriers' volumes, on telematics you don't control. If those vehicles aren't integrated, your "AI-powered visibility" covers the part of the network that was already easiest to manage — and the loads your customers call about most have no prediction at all.
4. The unlearned site
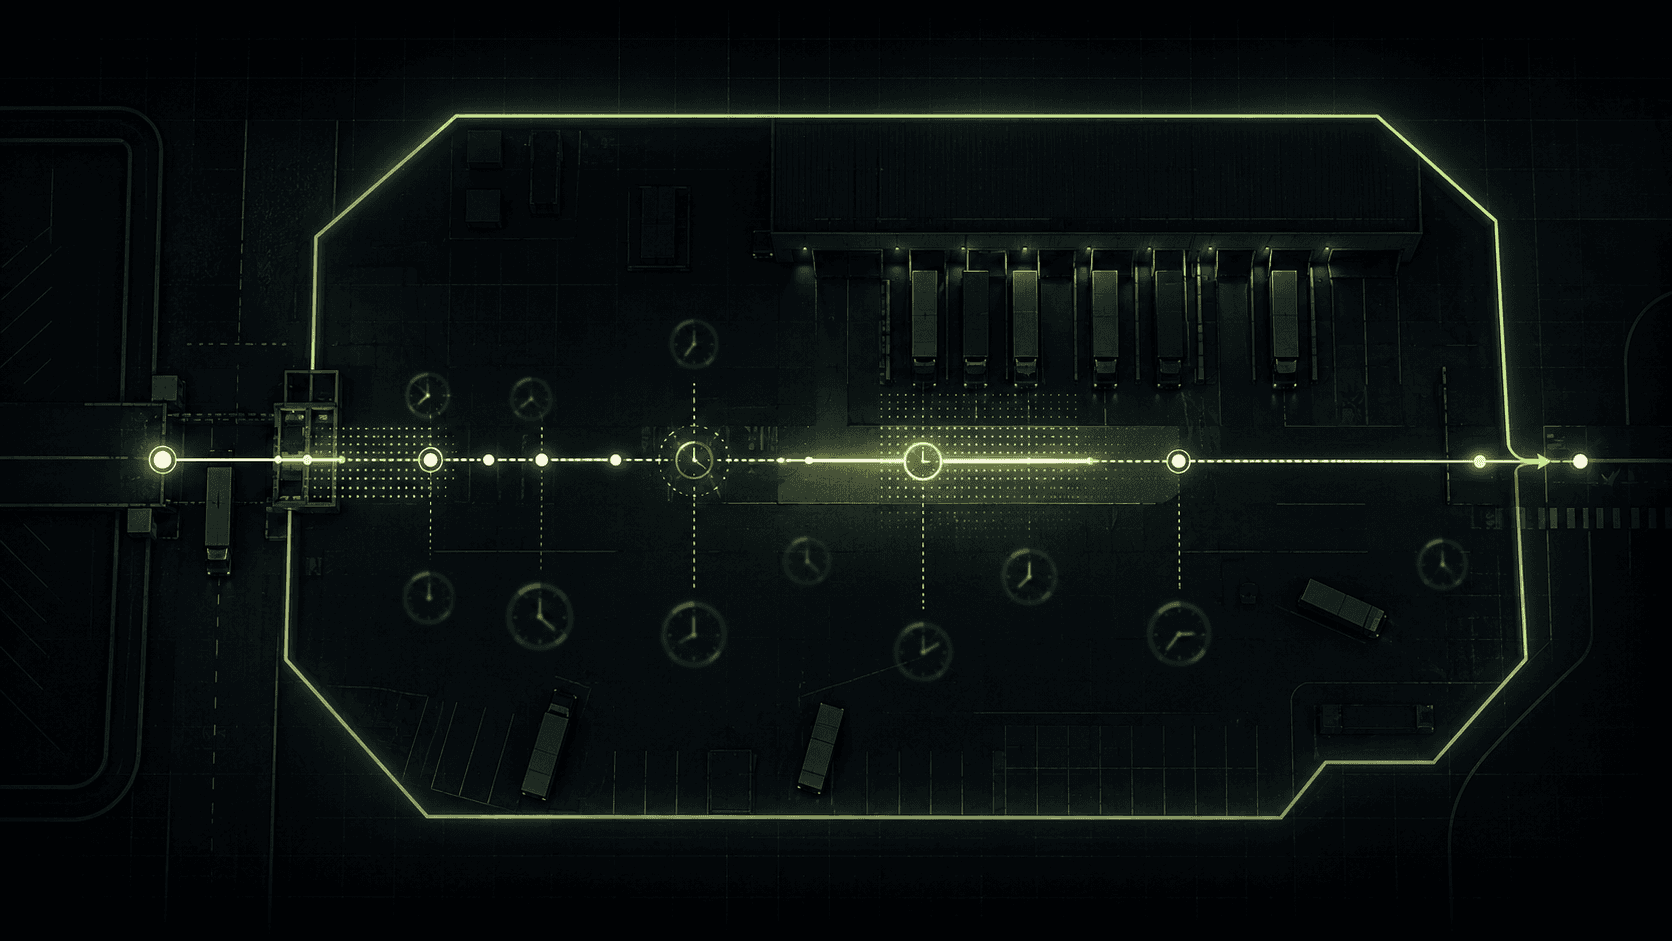
ETAs are usually wrong at the ends, not the middle: the motorway is predictable, the last kilometre and the gate are not. Site dwell — how long a location really takes, by weekday and hour — is learnable, but only from history with accurate geofence events. Feeds without clean arrival/departure detection never learn it, which is why naive ETAs are systematically optimistic at congested sites.
Normalisation is the ETA technology
Here is the uncomfortable truth for everyone selling prediction: among serious providers, the modelling techniques are broadly similar. The durable difference is upstream — who has more sources integrated, at higher frequency, normalised more rigorously, with deeper history across more lanes and sites. Whoever has the best data layer has the best ETA, almost regardless of who has the cleverest model.
That reframes the buying question. Instead of "is your ETA AI-powered?" (everyone says yes), ask: How many telematics systems can you read natively? What is the real update frequency per source — including subcontractors? How do you detect stops and site events? How much history does the prediction learn from on my lanes?
How CO3 does this today
CO3's role in the ETA chain is the input layer done properly: 500+ telematics and OEM integrations — trucks, trailers, subcontractor systems — normalised into a single API with consistent identifiers, units, and event definitions, no new hardware required. Positions, trips, and stop events arrive in one schema with the frequency of the underlying source made explicit, and completed-trip history accumulates per lane and site. That feed powers CO3's ETA predictions and is equally consumable by a customer's own models — the foundation either way.
Getting started: an ETA quality audit in three steps
- Measure your inputs, not your outputs. For each data source in your fleet: real ping frequency, latency, and coverage. Rank sources worst-first — that list, not the model, is your ETA improvement roadmap.
- Close the biggest coverage hole. Usually subcontractors. Integrating partner fleets typically improves perceived ETA quality more than any model change, because it creates predictions where there were none.
- Baseline and track accuracy honestly. Measure prediction error against actual arrivals, per lane, at fixed horizons (e.g., 4 hours out, 1 hour out). Improvements should show up in this number — if a vendor won't commit to measuring it, that tells you something.
Self-assessment: are your ETAs fed properly?
- Do you know the actual position-update frequency of every telematics source in your network?
- Are subcontractor vehicles producing ETAs in the same system as your own fleet?
- Does your ETA engine see driving-time status, not just position?
- Are arrival/departure events detected automatically via geofences?
- Is there at least a year of completed-trip history behind your predictions?
- Do you measure ETA accuracy against actual arrivals, per lane?
- When ETAs are wrong, can you trace whether the cause was input data or model?
- Are timestamps, units, and identifiers normalised across all sources?
Three or more "no" answers means better ETAs are available without touching a model — by fixing the diet.
What to watch over the next 12–18 months
- ETA accuracy becomes contractual. Shippers are starting to put prediction-quality expectations into visibility contracts; measured accuracy per lane will separate marketing from product.
- Driving-time-aware prediction spreads. Integration of tachograph/driving-time data into ETAs is becoming the differentiator for European road freight specifically.
- Agents act on ETAs. As agentic workflows book slots and notify customers automatically, ETA errors stop being cosmetic and start triggering wrong actions — raising the price of bad inputs.
- Data Act leverage. Strengthened EU rights to vehicle-generated data make it harder for any party to hold position data hostage — good news for closing subcontractor blackouts.
Closing thought
"AI-powered" is the least informative phrase in the ETA conversation. Predictions are a refinery: the crude oil is position data from your real, messy, mixed fleet, and the refinery cannot produce what the pipeline doesn't deliver. Fix frequency, normalisation, coverage, and history — in that order — and almost any modern model will reward you. CO3 builds exactly that input layer, across the whole fleet, subcontractors included.
Glossary
- ETA (Estimated Time of Arrival): Continuously updated predicted arrival time computed from live vehicle data.
- Ping / update frequency: How often a vehicle reports its position; the single biggest input determinant of ETA quality.
- Normalisation: Converting feeds from many telematics systems into one consistent schema (timestamps, units, identifiers, events).
- Interpolation: Estimating a vehicle's path between sparse position reports; a major source of ETA instability.
- Stop detection: Automatically recognising that a vehicle has arrived, departed, or is dwelling — the basis for labelled training history.
- Site dwell: Time vehicles spend at a location beyond driving; learnable per site/weekday from geofence history.
- Driving-time status: A driver's remaining legal driving and duty time under EU rules; decisive context for European ETAs.
- Prediction horizon: How far ahead an ETA is issued (e.g., 4 hours before arrival); accuracy should be measured per horizon.
- Geofence: Virtual perimeter around a site that triggers automatic arrival/departure events.













.png&w=3840&q=75)









.png&w=3840&q=75)