On-Time Performance in Road Freight: How to Measure It, What Good Looks Like, and Why Most Numbers Are Wrong

"What's your on-time rate?" sounds like a simple question. In practice, two carriers quoting "95% on time" can be describing completely different realities — different time windows, different measurement points, and different data sources. This post explains the main on-time metrics (OTD, OTIF, on-time pickup), what realistic benchmarks look like in European road freight, why self-reported numbers routinely overstate performance, and how to build an on-time measurement you would be happy to defend in a customer review.
Why on-time performance suddenly matters more
For years, on-time performance (OTP) in road freight was a soft topic: discussed in annual reviews, rarely measured consistently, almost never contractual. Three things changed that.
First, large shippers and retailers formalised it. The best-known example is the US retail sector, where compliance programmes set explicit thresholds — 90% on-time and 95% in-full in the most cited scheme — with financial penalties for missing them. European retailers and industrial shippers have followed with their own scorecards.
Second, capacity got scarce. With hundreds of thousands of driver positions unfilled across Europe and truck registrations falling, shippers increasingly choose carriers on demonstrated reliability, not just price. A defensible on-time number is becoming a sales asset.
Third, measurement became possible. Real-time visibility means arrival times can be recorded automatically rather than reconstructed from paperwork. That removes the excuse — and the wiggle room.
The metrics, untangled
On-Time Delivery (OTD). The share of deliveries arriving within the agreed window. Sounds simple; the devil is in the window. "On the agreed day" produces a very different score than "within the 2-hour slot". Always state the window with the number.
On-Time In-Full (OTIF). The stricter, shipper-side metric: the delivery must arrive on time and complete — right items, right quantity, undamaged. Because two conditions are multiplied, OTIF is always lower than OTD. Top-performing supply chains report OTIF in the 95–98% range; many sectors operate realistically in the 80–90% band.
On-time pickup. The forgotten half. A late pickup almost always becomes a late delivery, and pickup punctuality is the half the carrier controls least — it depends on the shipper's ramp. Measuring it protects carriers: if you were loaded three hours late, that should be in the data.
Arrival accuracy vs slot compliance. Increasingly, sites measure not just lateness but earliness — an early truck congests the yard. The most mature operations measure arrival against a booked slot, both directions.
A note on what "on time" should mean in your contracts: pick the measurement point (gate arrival vs dock door vs POD), the window, and the data source — and write all three down. Most on-time disputes are definitional, not factual.
Where road freight operators get stuck
The paperwork mirage
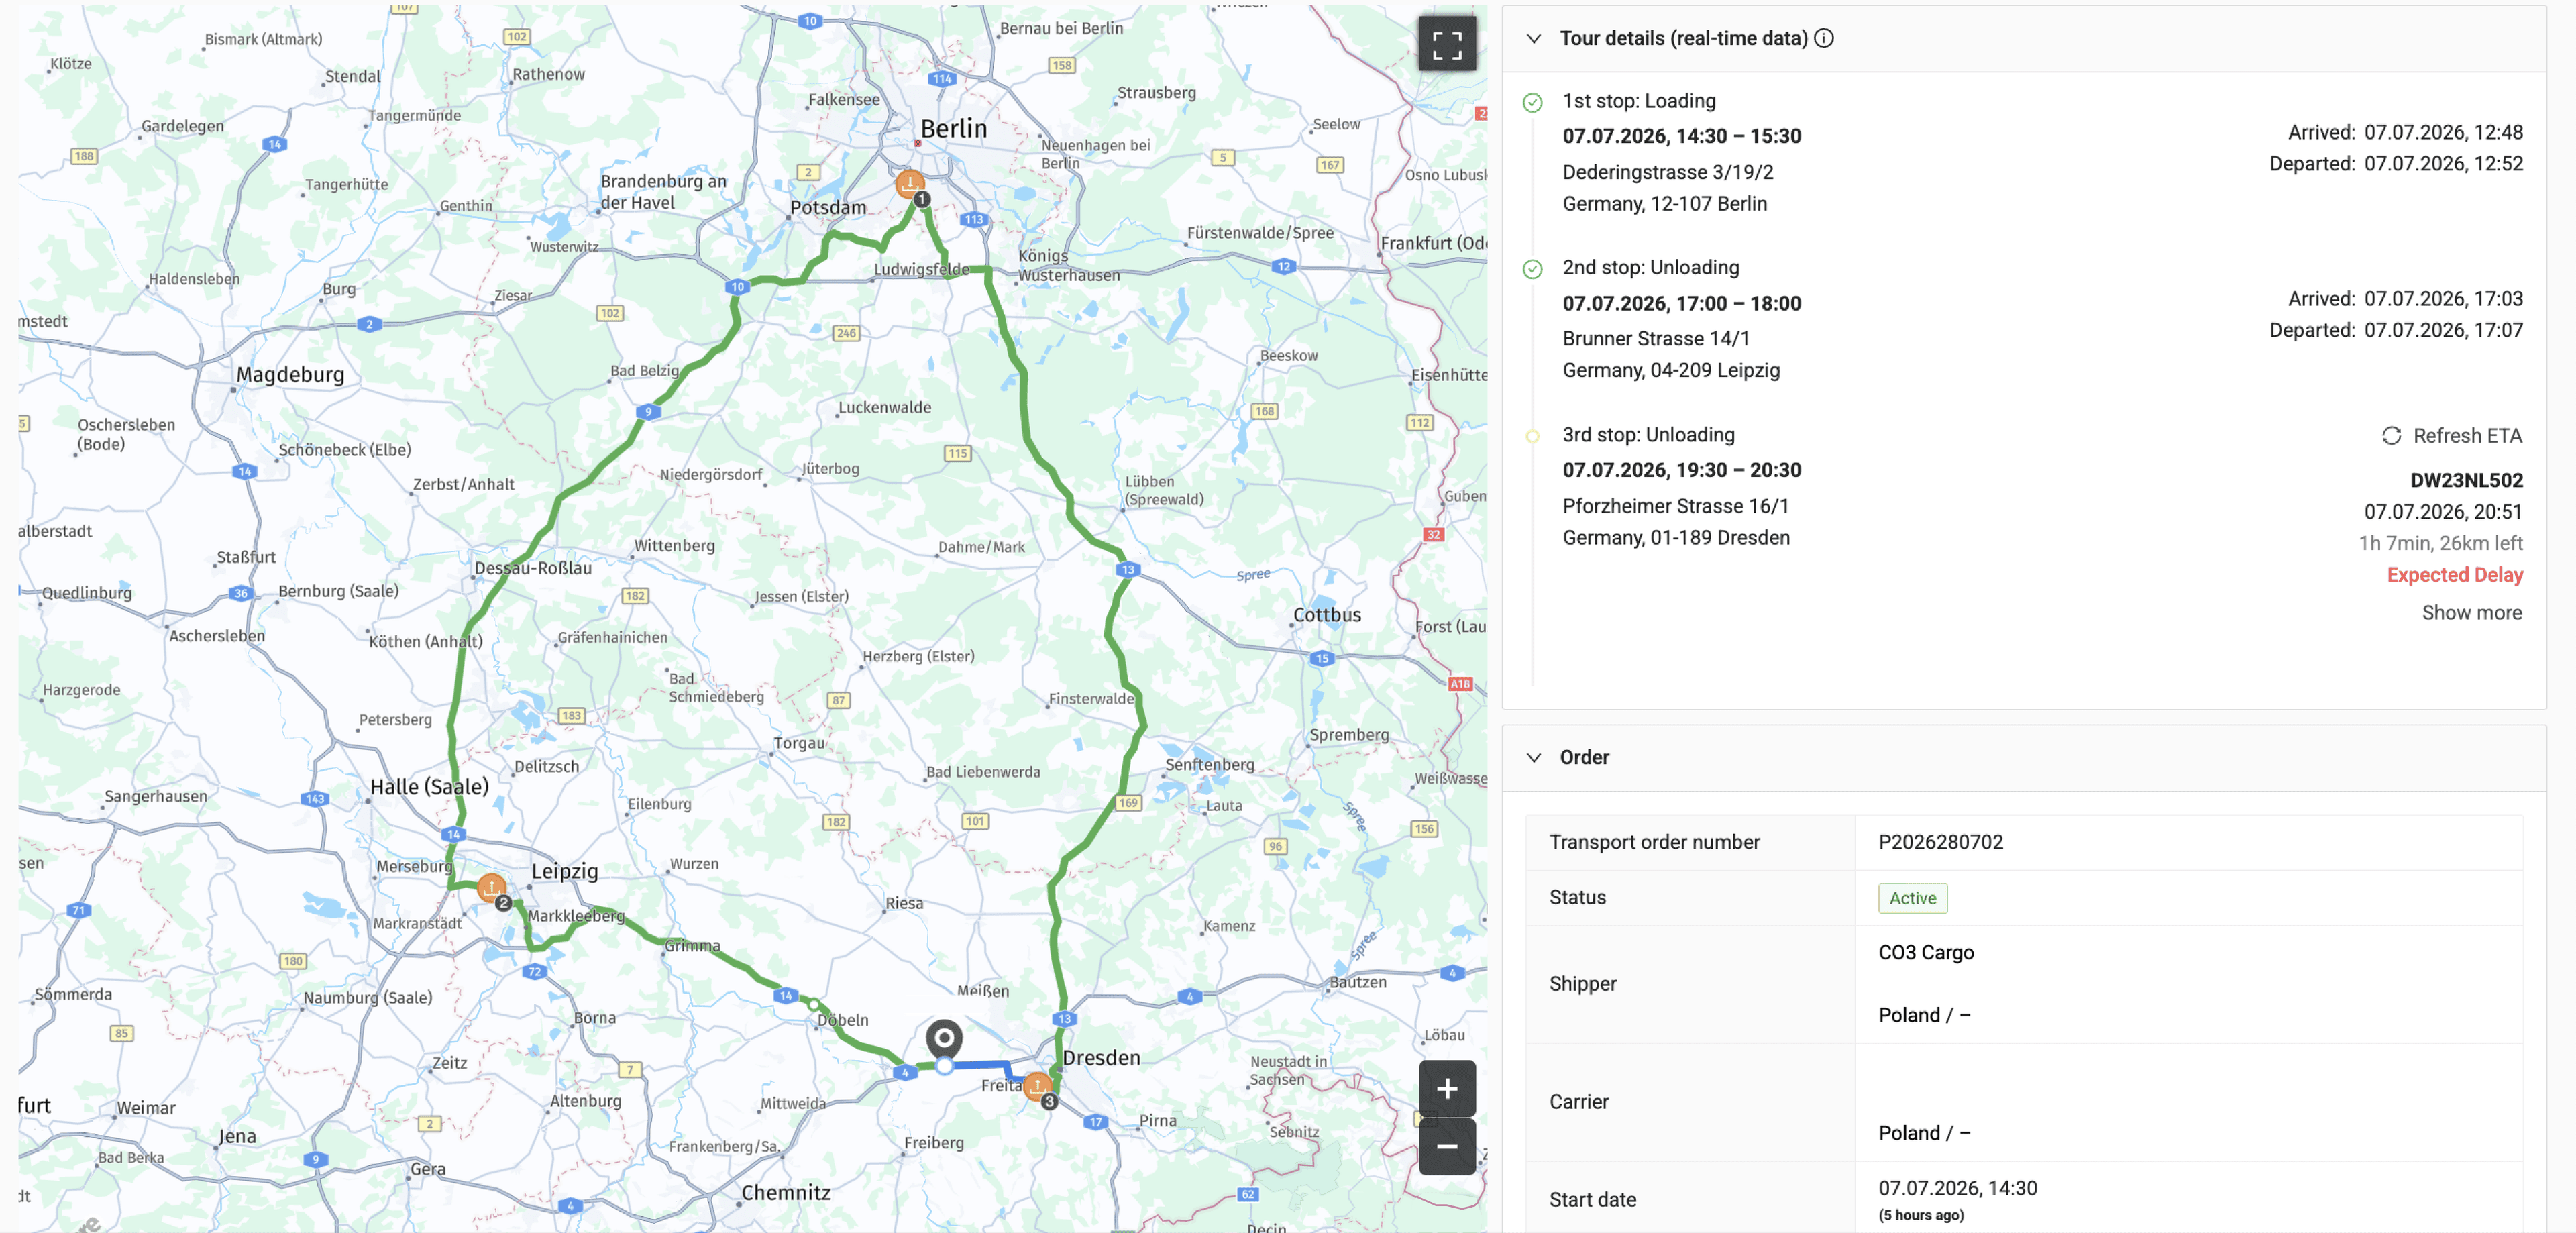
Self-reported on-time rates based on driver confirmations or scanned PODs run systematically high. Arrival gets recorded as the time the paperwork was signed — often long after the truck reached the fence. When carriers switch to automatic GPS-based timestamps, the measured rate typically drops first: not because performance worsened, but because reality entered the dataset. Treat this dip as calibration, not failure.
The subcontractor blind spot
Many European carriers run 30–70% of volumes through subcontractors. If their vehicles are not in your data feed, your on-time number describes a minority of your traffic. A reliability claim that excludes subcontracted legs is marketing, not measurement.
The averaging trap
A single fleet-wide OTP number hides everything useful. 94% overall can mean 99% on domestic lanes and 81% on the Alpine corridor that your most important customer cares about. On-time performance only becomes manageable when cut by lane, customer, site, and weekday.
Punctuality without causes
Knowing you were late is the cheapest insight. Knowing why — late pickup, border dwell, ramp congestion at the destination, traffic, or simply an unrealistic schedule — is what changes the number. Cause attribution requires trip-level data: where the vehicle actually was, and when.
Building an on-time measurement you can defend
- Automate the timestamps. Geofence-based arrival and departure events at pickup and delivery sites, straight from vehicle telematics. No manual entry anywhere in the chain.
- Agree definitions per customer. Measurement point, window, slot logic — documented once, then applied consistently by the system.
- Cover the whole fleet, including subcontractors. One data layer across own vehicles and partners, or the number stays partial.
- Cut the number by lane and cause. Weekly review per traffic; every miss tagged with a cause category.
- Share it proactively. Carriers that bring their own punctuality dashboard to customer reviews control the narrative — and the conversation about the misses that were the shipper's ramp, not the carrier's driving.
How CO3 does this today
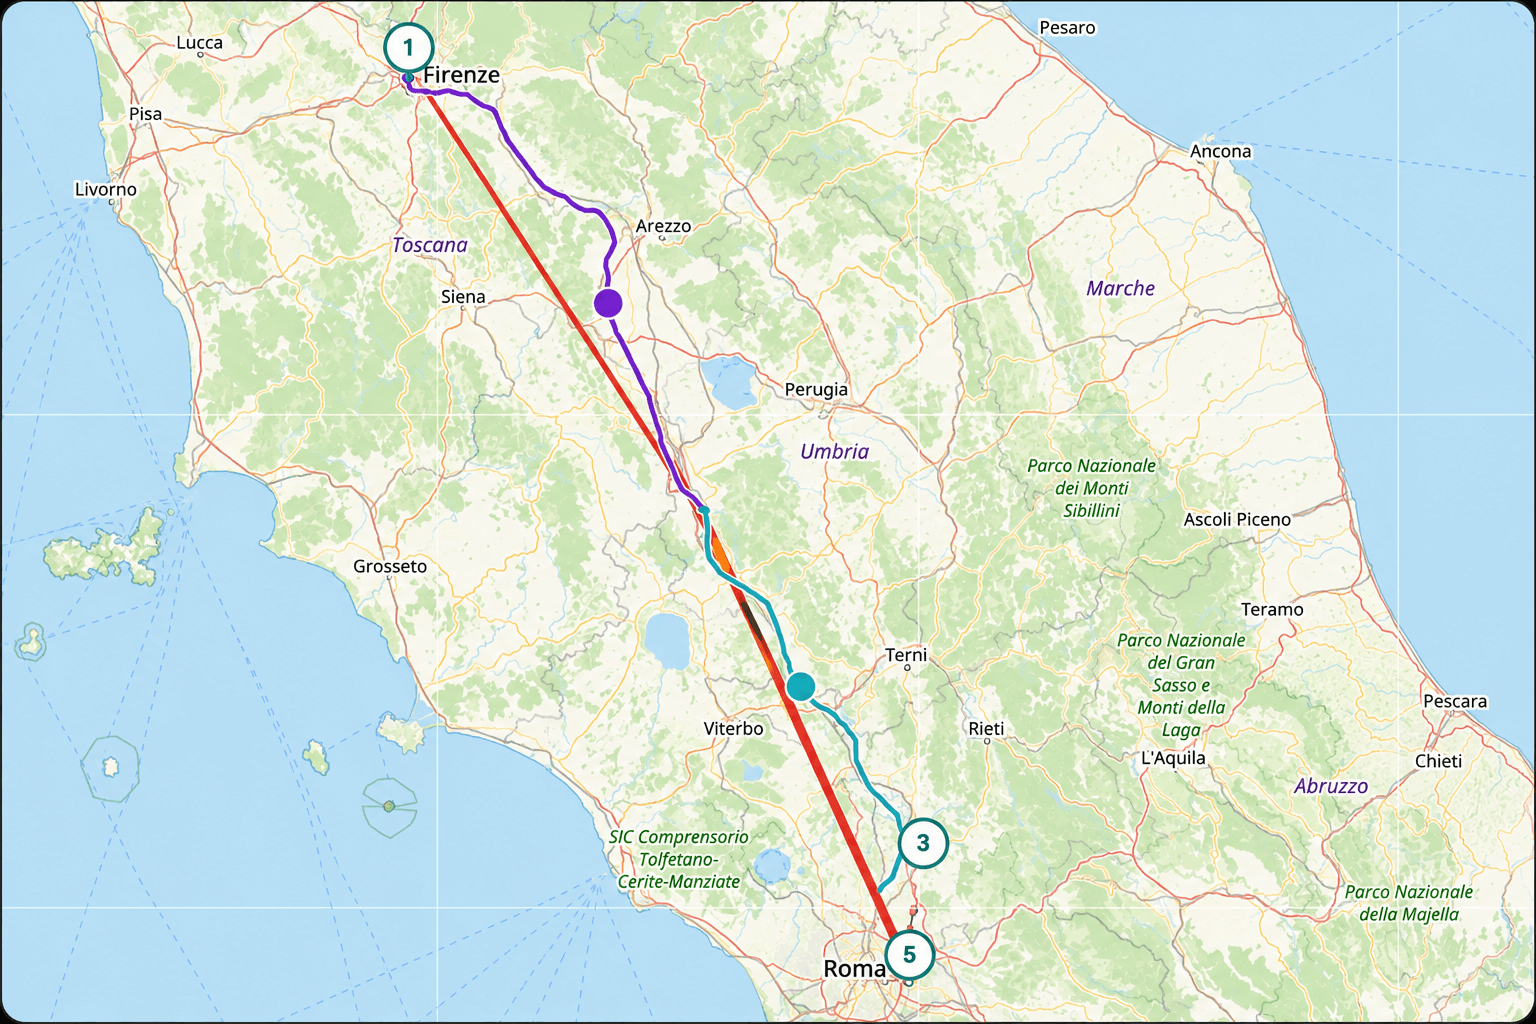
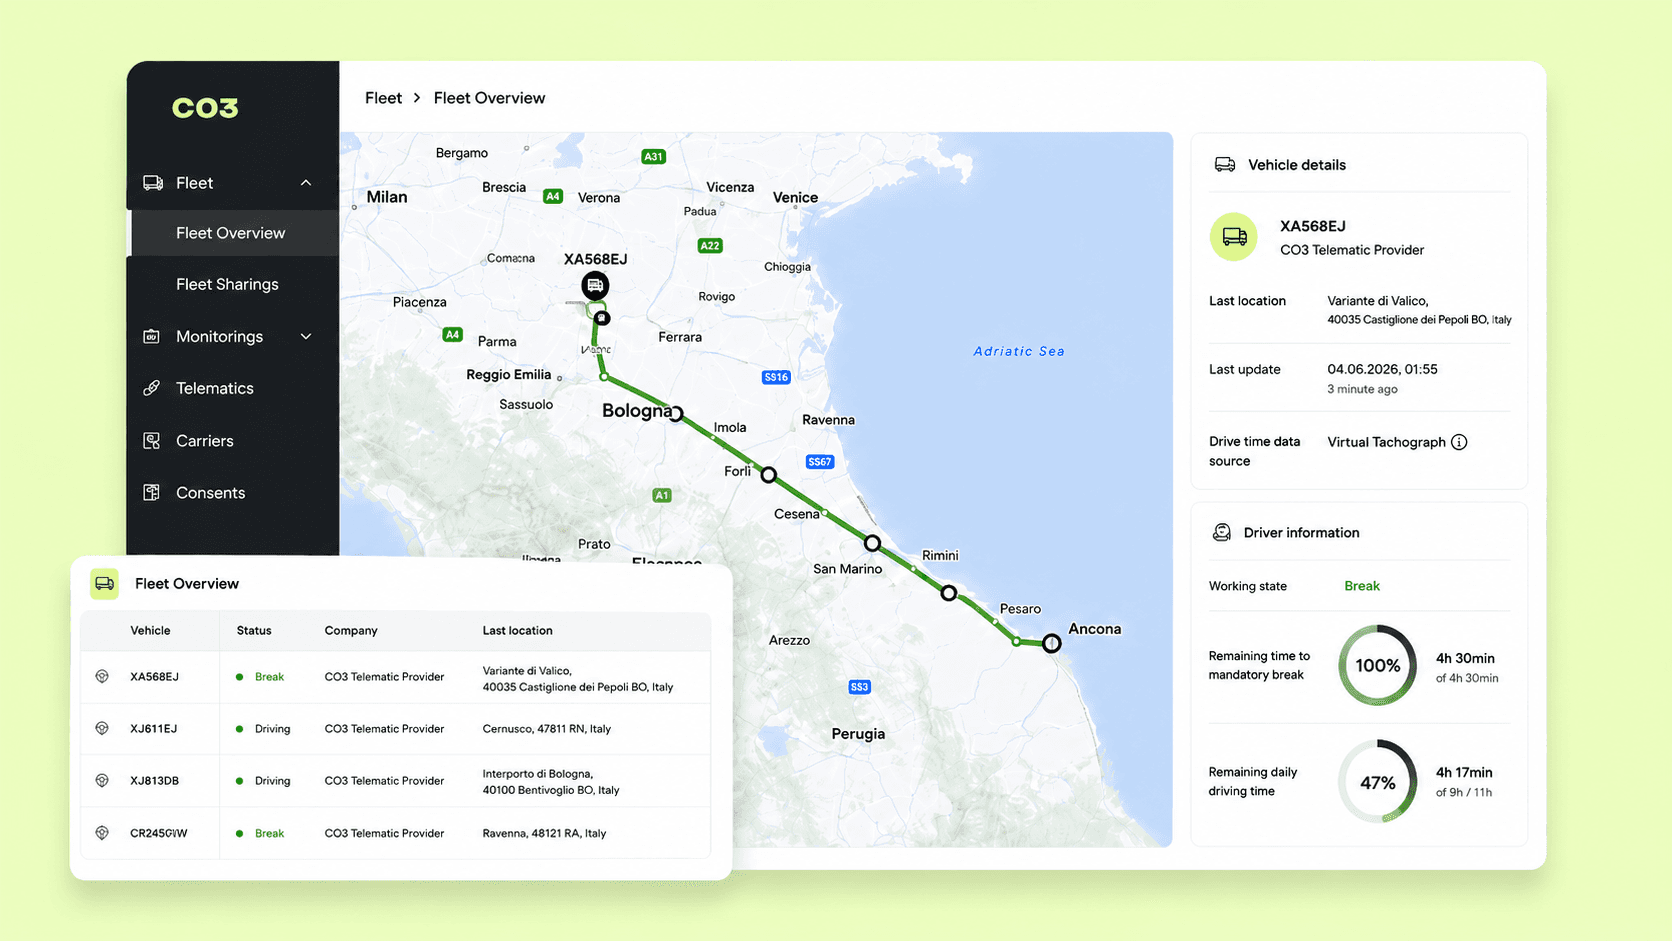
CO3 connects trucks, trailers, and subcontractor vehicles through 500+ telematics integrations into a single API — no new hardware. Position and trip data arrive in one normalised feed, which is the raw material for automatic arrival/departure timestamps and lane-level punctuality analysis across the entire fleet, subcontractors included. The same feed powers ETA predictions, so customers see problems coming instead of reading about them in next month's scorecard.
Getting started without boiling the ocean
- Instrument your top 5 customer sites first. Geofence them, collect four weeks of automatic timestamps, and compare against what you have been reporting.
- Reconcile the definitions. Where the automatic number diverges from the reported one, fix the definition, not the data.
- Take it to one customer. Pick a constructive one. Agree the metric, share the dashboard, and use the cause split to separate carrier misses from site misses.
Self-assessment: is your on-time number real?
- Is arrival time recorded automatically (GPS/geofence), not from paperwork?
- Do you know your measurement point — gate, dock, or POD — and is it consistent?
- Are subcontractor legs included in your OTP number?
- Can you state your on-time rate per lane and per customer site?
- Is every late delivery tagged with a cause?
- Do you measure on-time pickup as well as delivery?
- Would your number survive comparison against your customer's gate log?
- Do you review punctuality weekly, per traffic, rather than annually?
Three or more "no" answers means your on-time number is an estimate, not a measurement. CO3 can help you replace it with one you can defend.
What to watch over the next 12–18 months
- Scorecards spread downstream. OTIF-style programmes are moving from retail giants to mid-size European shippers; expect punctuality clauses in more RFPs.
- Slot booking meets visibility. Yard and slot systems increasingly consume live ETAs; arrival accuracy against booked slots becomes the metric that matters at congested sites.
- Benchmarking gets public. As more of the market runs on measured (not reported) timestamps, expect published lane-level punctuality benchmarks — and pressure on carriers whose self-reported numbers don't match.
- Reliability pricing. With capacity structurally tight, carriers with proven OTP data are starting to price it; reliability is becoming a sellable attribute, not a hygiene factor.
Closing thought
Every carrier claims to be reliable; very few can prove it per lane, per site, with automatic timestamps and subcontractors included. The gap between claiming and proving is where contracts will be won over the next few years. Measure first, define honestly, and bring your own data to the review. CO3 can get the measurement layer running across your fleet — own vehicles and partners — in weeks.
Glossary
- OTP (On-Time Performance): Umbrella term for punctuality metrics in transport.
- OTD (On-Time Delivery): Share of deliveries arriving within the agreed time window.
- OTIF (On-Time In-Full): Share of orders delivered both on time and complete (right items, quantity, condition). Always ≤ OTD.
- On-time pickup: Share of loads collected within the agreed window at origin.
- POD (Proof of Delivery): The signed confirmation that goods were delivered; often used (badly) as an arrival timestamp.
- Geofence: Virtual boundary around a site used to record automatic arrival/departure events.
- Slot compliance: Arrival measured against a booked loading/unloading slot, penalising both late and early arrival.
- ETA (Estimated Time of Arrival): Predicted arrival time, updated live from vehicle position data.
- Cause attribution: Tagging each late event with its root cause (late pickup, congestion, border dwell, etc.).






























.png&w=3840&q=75)











.png&w=3840&q=75)